
.png)
.png)
Weekly Recap : Crypto Rates W46

Market Overview
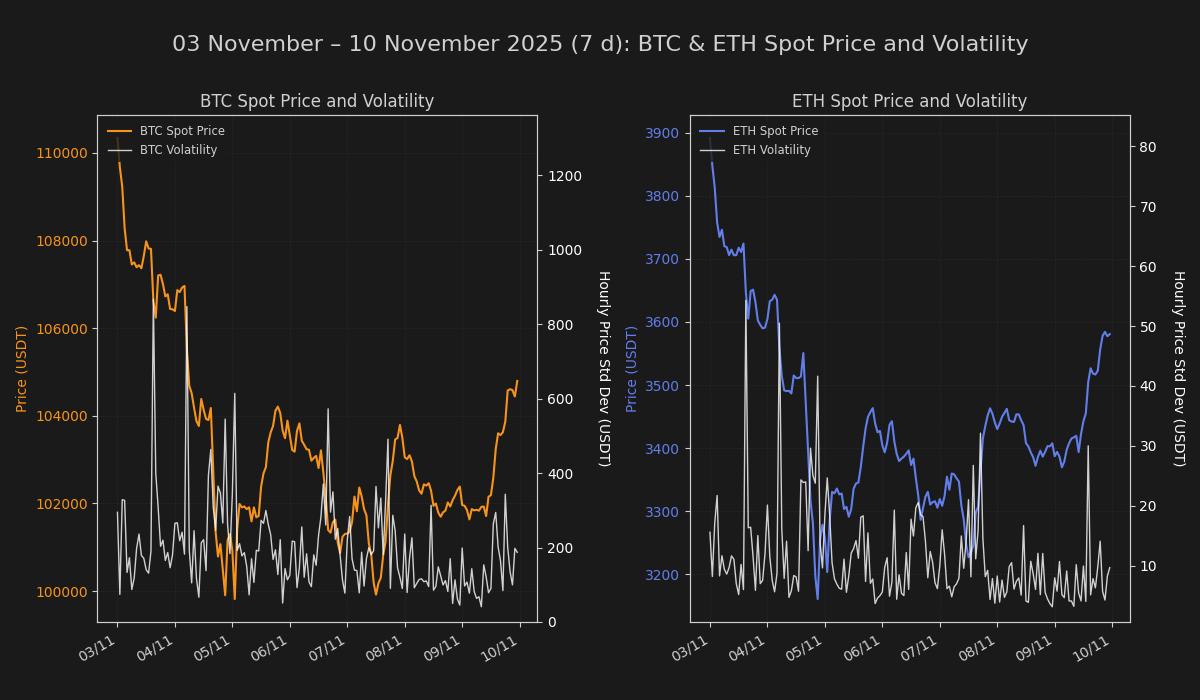
The digital asset complex is exhibiting signs of structural stabilization following the volatility observed in late October. Price action has begun to firm up around the $100k–$106k technical shelf, suggesting a potential exhaustion of immediate sell-side pressure. While on-chain metrics indicate a resumption of capital velocity, the broader sentiment remains cautious; speculative open interest has contracted, and ETF flows reflect profit-taking rather than renewed accumulation. The market appears to be transitioning from a corrective phase into a tentative consolidation, awaiting a catalyst to challenge overhead resistance.
Rates & Basis Analysis: Bitcoin and Ethereum
The perpetual swaps market has undergone a notable decompression in leverage costs. Bitcoin (BTC) annualized funding rates on centralized exchanges have compressed significantly compared to the prior period. While the previous week saw rates spiking toward 9.15%, the current regime is characterized by a tighter, more muted range between 1.80% and 5.70%. This contraction in funding costs implies a washing out of "frothy" long positioning and a return to a more sustainable, albeit less aggressive, leverage environment.
Ethereum (ETH) funding reveals a distinct divergence in sentiment. Unlike Bitcoin, which maintained positive baseline funding, ETH rates have exhibited structural weakness, frequently dipping into negative territory. Annualized readings for the current week oscillated between -5.96% and +3.60%, a bearish shift from the more consistently positive bias seen previously. This suggests that ETH is currently acting as a funding source or hedge for broader portfolio beta, rather than a primary vehicle for upside speculation.

The regulated futures term structure has seen a dramatic normalization. The previous week was marked by extreme dislocation in the CME annualized basis, with readings showing erratic swings into deep backwardation (reaching lows of -478% for BTC and -787% for ETH), likely driven by expiry dynamics or liquidity voids.
This week, the curve has restabilized into a standard contango structure. BTC CME basis has settled into a healthy range of 4.13% to 21.72%, while ETH CME basis has similarly recovered to positive territory (up to 30.33%).

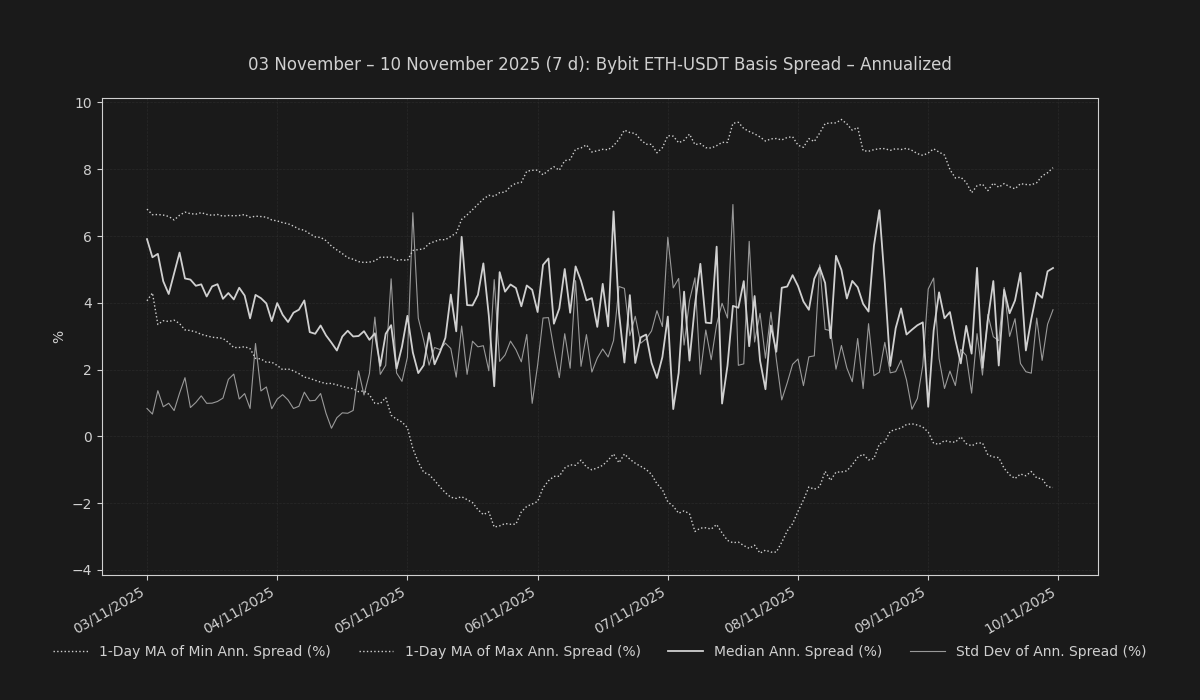
In the offshore market, the annualized rolling basis remains modest. On Bybit, the 7-day annualized rolling basis for Bitcoin closed near 4.38%, while Ethereum lagged slightly at 3.94%. The lack of significant premium expansion in the offshore basis corroborates the thesis of a deleveraged market lacking strong directional conviction.
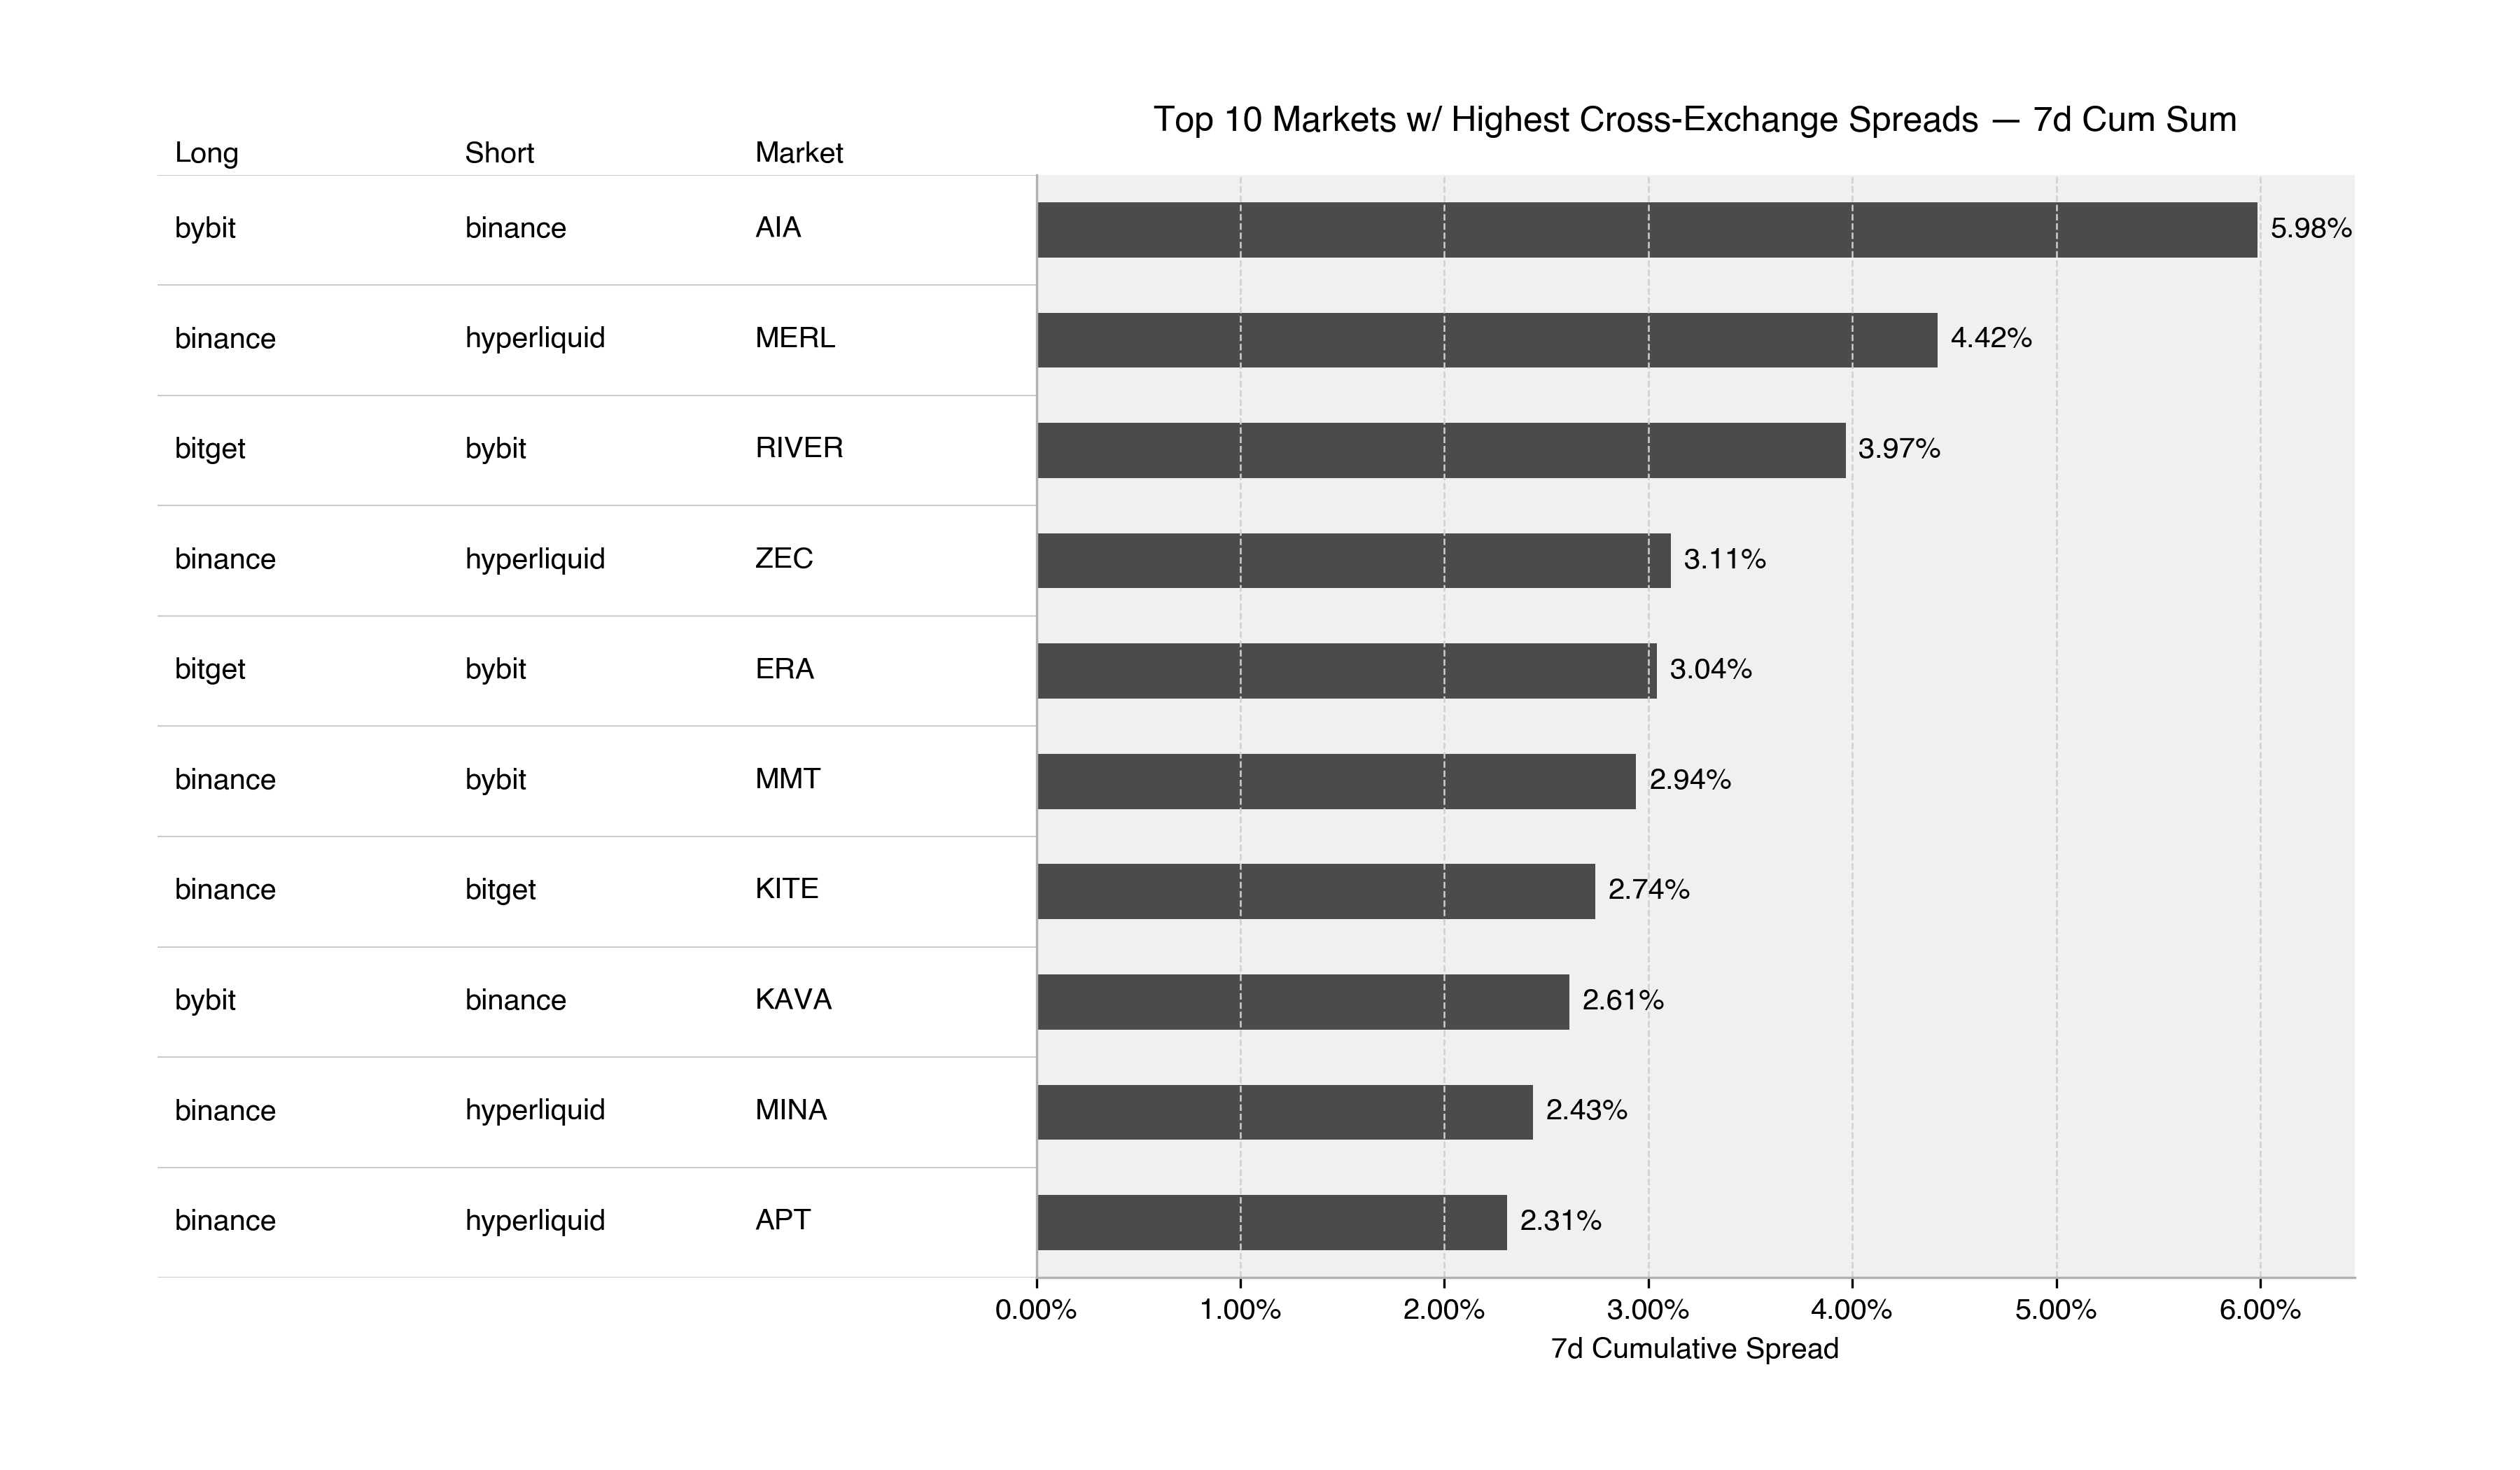
Funding Arbitrage & Market Dislocations
Despite the compression in headline rates, volatility in cross-exchange liquidity has generated attractive delta-neutral yield opportunities. We have identified specific dislocations where capital fragmentation has created significant spreads.
- AIA (Short Binance / Long Bybit): This pair offered the most significant yield generation, with a 7-day cumulative raw spread of approximately 0.0598 (nearly 6% unannualized). This spread indicates a heavily skewed short positioning on Binance relative to Bybit, allowing for profitable carry capture.
- MERL (Long Binance / Short Hyperliquid): A structural divergence was also observed in the MERL market, offering a cumulative spread of roughly 0.044. In this instance, Hyperliquid participants were paying aggressive funding on shorts, contrasting with the liquidity profile on Binance.
Altcoin Funding Dynamics
Beneath the majors, the altcoin rates complex signals a defensive rotation, with speculative flows increasingly crowding the short side of specific assets.
Comparing the 8-hour funding sum profiles over the last two weeks reveals a deterioration in sentiment for Ethena (ENA). On Binance, the cumulative funding sum deepened from roughly -0.0001 in the prior week to -0.0005 in the current period. This expansion in negative funding indicates that shorts are becoming increasingly willing to pay premium carry costs to maintain bearish exposure.
Similarly, Sei (SEI) on Hyperliquid exhibited a continued bearish bias. The cumulative funding rate deepened from -0.0003 to approximately -0.0006. This persistence in negative funding across multiple venues suggests that for high-beta altcoins, the path of least resistance currently remains lower, with sellers absorbing any liquidity bids.

Conclusion
The current rates environment reflects a market in reset; the "easy" beta trade has paused as funding costs compress and basis premiums normalize. With ETH funding tilting negative and altcoin shorts paying up for exposure, the skew is decidedly defensive, favoring delta-neutral carry strategies over aggressive directional risk until spot demand re-accelerates.